ILLUSTRATIVE WORKSPACEExecutive revenue pulse
ExampleRevenue$2.48M+12.4%
Orders18,420+8.1%
Margin42.8%+2.6%
Revenue trendLast 12 months
Visual reporting and embedded analytics
Connect your databases and files, build reports together, and explore the numbers behind every chart. Share interactive dashboards with your team and customers, or export the view they need.
Connect the tools already holding your data
Inside SwitchLens
Explore the report editor, dashboard library, and embedded experience. These product previews use sample data.
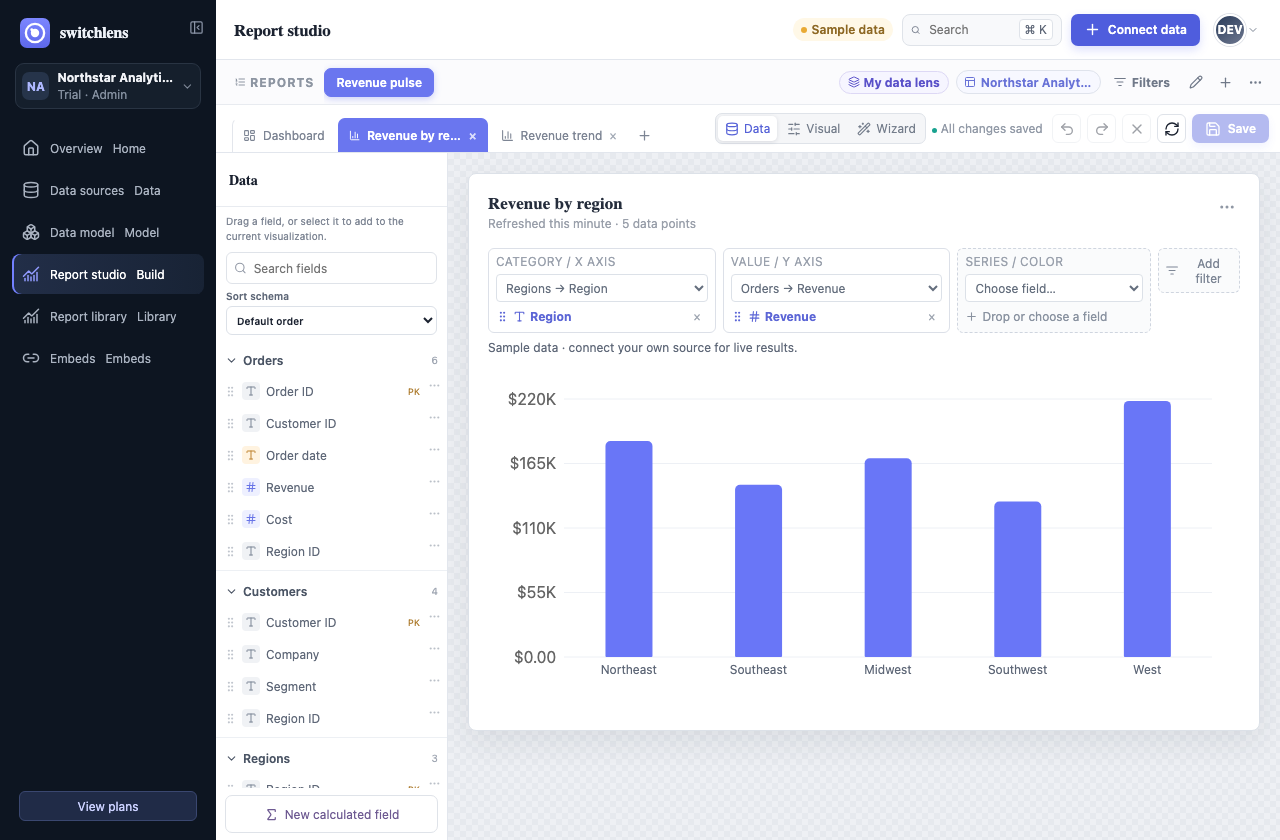
Choose fields, set chart roles, and see the result as you work. Arrange charts, tables, and KPIs into a dashboard your audience can follow.
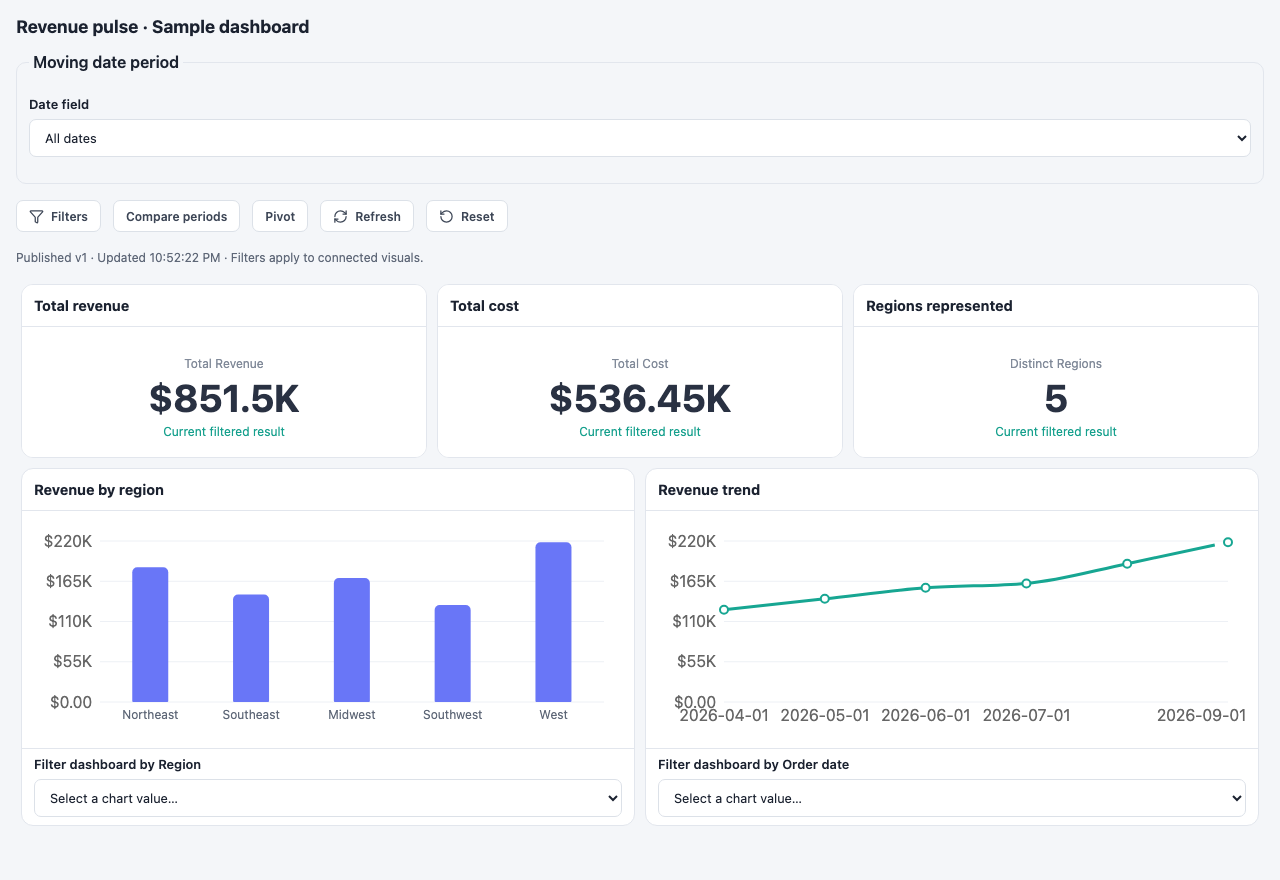
Explore dashboard results, compare periods, and keep useful analysis as a saved view. Export the layout when your audience needs a snapshot.
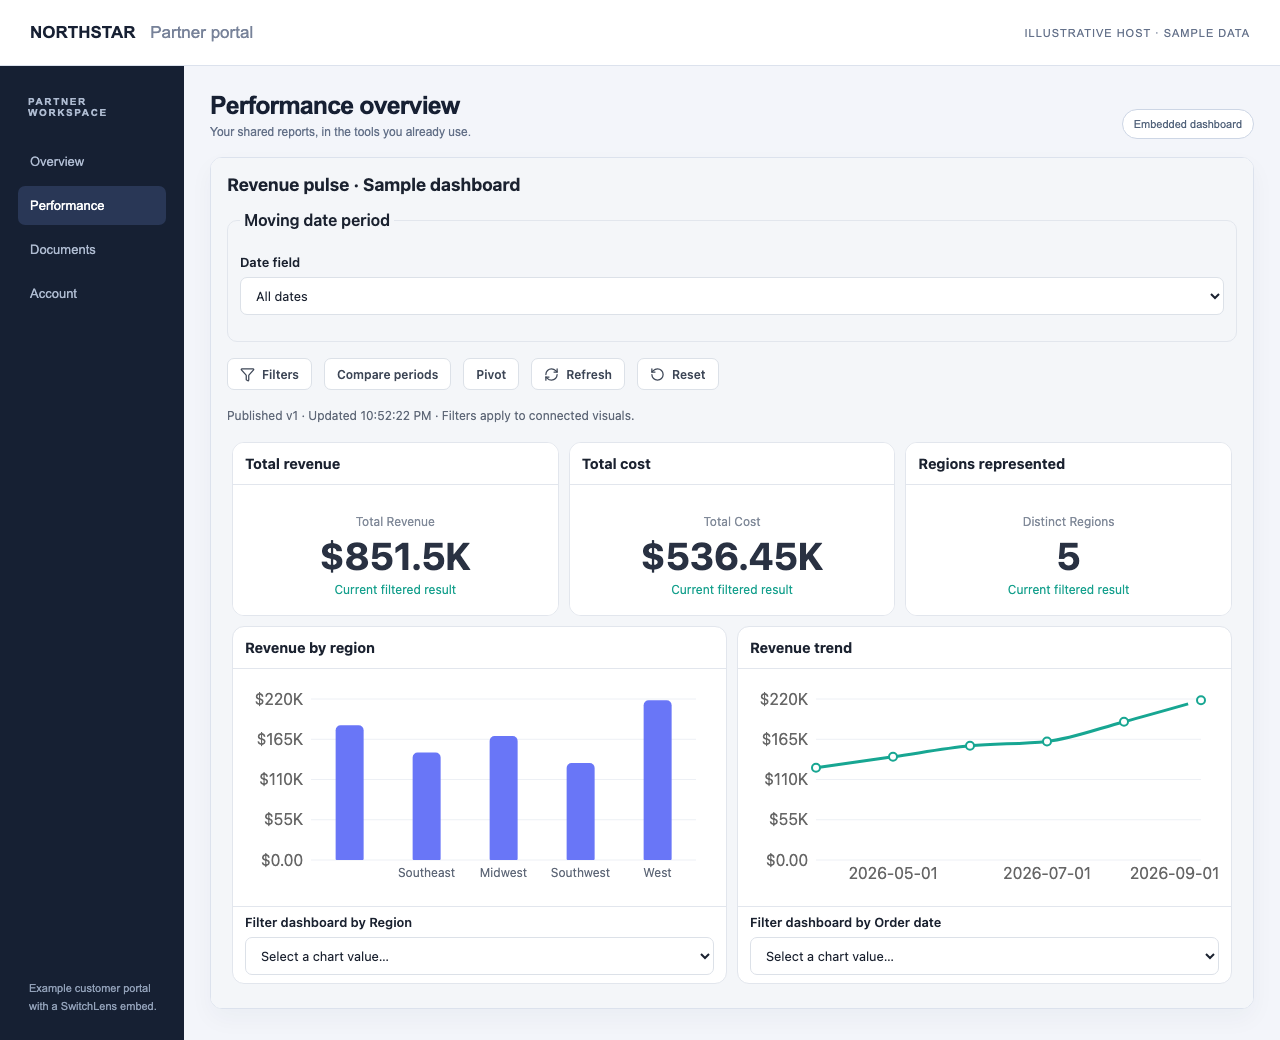
Publish the report, set the audience, and embed a dashboard where your customers already work. Connect your app's filters with the dashboard SDK.
One reporting workflow
Bring databases and spreadsheets into one reporting workflow. Model relationships, build interactive charts, and control what your team and customers can see.
Own a source in a personal account or workspace, then assign the same canonical source to several workspaces without cloning credentials.
Inspect fields, curate labels, and draw multi-column relationships that the query planner actually uses.
Build tables, charts, KPIs, and dashboards with a visual editor and chart wizard. Undo changes and recover unsaved drafts as you work.
Turn a validated read-only query into a reusable source for tables, aggregate charts, and KPIs. Edit the query as your analysis evolves.
Leave static files on Never, refresh manually, or use eligible 4-, 12-, or 24-hour schedules. Business plans can fetch same-schema SFTP files up to 10 MiB.
Invite colleagues with expiring links and assign User, Power, or Admin roles. Compare conflicting edits before replacing work and review administrator audit history.
Explore, reuse, and share
The Report library brings exploration, saved analysis, publishing, and exports together, with the dashboard layout you built in Studio.
Filter dashboards, inspect underlying records, sort and page through results, and build pivots. Reuse metrics, compare periods, and follow trends with rolling averages.
Keep personal or shared views with links, defaults, and your latest selection. Calendar and fiscal date ranges move with time, so recurring analysis stays relevant.
Publish report versions, preview earlier definitions, and restore a previous version. Duplicate reports or turn them into workspace templates, then see how dashboards are used.
Download dashboard PDF and PNG snapshots with your layout and current table page. Export complete permitted results to Excel or data PDFs within export limits.
Preview schema changes and map renamed columns while preserving report connections. Review source history and restore retained files or source definitions.
Choose schedules in your timezone, threshold alerts, and report attachments. Edit or pause subscriptions and review delivery history.
Email delivery is not active yet. You can prepare paused schedules now; report downloads and copyable invitation links are available.
How it works
Select the schemas, tables, sheets, or files that belong in the source.
Make types, labels, keys, and relationship paths understandable.
Drag fields into a visual or use the chart wizard to get a useful starting point.
Publish a report version, embed a visual or dashboard, or download an export for your audience.
Security without theater
No badge wall and no unsupported certification claims—just clear boundaries around identities, credentials, queries, files, and sharing.
Tenant-scoped records and explicit User, Power, and Admin roles limit who can manage data and publish content.
Connector credentials are encrypted before persistence and are not returned in normal browser workspace payloads.
Uploads, discovery, query shape, cached results, and read-only custom SQL are constrained rather than treated as unlimited compute.
Security controls reduce risk; they do not guarantee uninterrupted service or make SwitchLens suitable for every regulated workload. Review the Privacy Policy before connecting sensitive data.
Simple account pricing
One subscription covers every workspace in the account. Upgrade only when you need more collaboration, automation, or embed controls.
Plan details will appear when the SwitchLens API is available.
Prices are monthly in U.S. dollars. Plan and security limits apply. Prices exclude taxes unless checkout or an order states otherwise. Paid subscriptions are managed through Stripe's hosted billing pages.
Common questions
A few practical answers about visual reporting, interactive dashboards, and working with your data.
Connect PostgreSQL, MySQL, MariaDB, and SQL Server, or upload CSV, TXT, XLS, and XLSX files. Eligible plans also support validated read-only SQL queries as reusable sources for tables, charts, and KPIs.
Yes. Drag fields into tables, charts, KPIs, and dashboards, or use the chart wizard for a starting point. Configure filters, sorting, formatting, and relationships visually. Custom SQL is available when you need it.
Yes. Embed individual visuals or complete published dashboards. Individual visuals offer search, filters, reset, refresh, and table sorting. Dashboard embeds support approved websites, public or workspace access, and customer sessions with row and column restrictions. Customer sessions connect through your application's server.
Save personal or shared views with filters, sorting, comparisons, and pivots. Export complete permitted results to Excel or data PDFs within export limits. Dashboard PDF and PNG snapshots preserve the layout and current table page.
Email delivery is not active yet. You can prepare paused subscriptions with timezone schedules, report attachments, and threshold conditions. Report downloads and copyable workspace invitation links are available now.
Refresh reports to retrieve updated data. Before applying schema changes, preview the differences and map compatible renamed columns to preserve report references. Source history restores retained files and definitions; external database records are managed in your database.
Bring the next answer into focus
Build the model where your team can see it, then publish only what they should use.